stairs#
- named_arrays.plt.stairs(*args, ax=None, axis=None, where=True, **kwargs)#
A thin wrapper around
matplotlib.axes.Axes.stairs()for named arrays.The main difference of this function from
matplotlib.pyplot.stairs()is the addition of theaxisparameter indicating along which axis the lines should be connected.Another difference is that this function swaps the order of values and edges so that the signature matches
plot().- Parameters:
args (AbstractArray) – Either a single instance of
AbstractScalarrepresenting the step heights, or a pair of instances ofAbstractScalarrepresenting the edges and heights.ax (None | Axes | ScalarArray[ndarray[tuple[Any, ...], dtype[Axes]]]) – The instances of
matplotlib.axes.Axesto use. IfNone, callsmatplotlib.pyplot.gca()to get the current axes. If an instance ofnamed_arrays.ScalarArray,ax.shapeshould be a subset of the broadcasted shape of*args.axis (None | str) – The name of the axis that the plot lines should be connected along. If
None, the broadcasted shape ofargsshould have only one element, otherwise aValueErroris raised.where (bool | AbstractScalar) – A boolean array that selects which elements to plot
kwargs – Additional keyword arguments passed to
matplotlib.axes.Axes.stairs(). These can be instances ofnamed_arrays.AbstractArray.
- Return type:
Examples
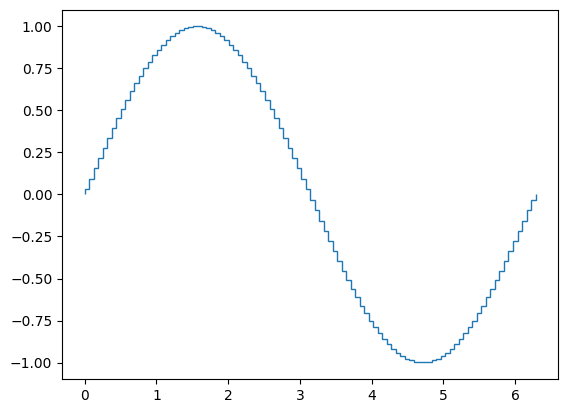
Plot a single scalar
import numpy as np
import matplotlib.pyplot as plt
import named_arrays as na

x = na.linspace(0, 2 * np.pi, axis="x",  num=101)

a = na.linspace(0, 2 * np.pi, axis="x", num=100, centers=True)
y = np.sin(a)

plt.figure();
na.plt.stairs(x, y);
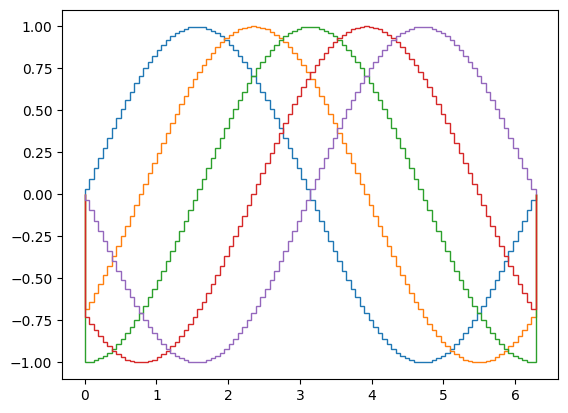
Plot an array of scalars
z = na.linspace(0, np.pi, axis="z", num=5)

y = np.sin(a - z)

plt.figure();
na.plt.stairs(x, y, axis="x");
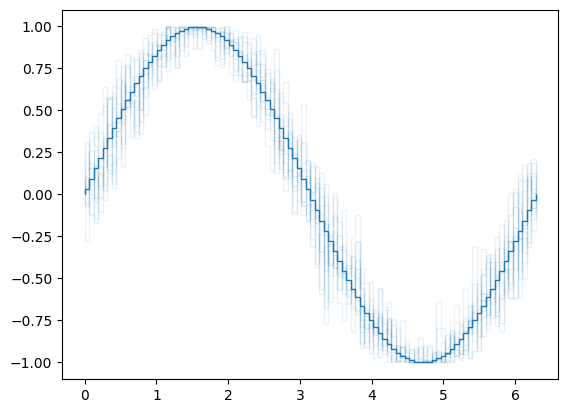
Plot an uncertain scalar
ua = na.NormalUncertainScalarArray(a, width=0.2)
uy = np.sin(ua)

plt.figure();
na.plt.stairs(x, uy);