dimension#
- named_arrays.plt.dimension(a, b, offset=0, label=None, decimals=2, gap=0.1, rotate=True, ax=None, components=None, arrowstyle='<->', kwargs_extension=None, kwargs_dimension=None, kwargs_text=None, **kwargs)#
Annotate the distance between two points like a mechanical drawing.
A dimension line with arrowheads at both ends is drawn parallel to the segment connecting a and b, joined to each point by an extension line. The dimension line can be displaced to either side of the segment using the offset parameter, which is useful for moving the annotation clear of other components in the drawing.
- Parameters:
a (AbstractCartesian2dVectorArray) – The first point being dimensioned, in data coordinates.
b (AbstractCartesian2dVectorArray) – The second point being dimensioned, in data coordinates.
offset (float | Quantity | AbstractScalar) –
The displacement of the dimension line from the segment connecting a and b. The magnitude is given in data coordinates, but the direction is perpendicular to the segment as it appears on screen, computed from the data-to-display transform so that the displacement looks orthogonal and the label is rotated correctly even when the aspect ratio is not equal. Positive values displace the dimension line 90 degrees counterclockwise from the direction pointing from a to b, negative values displace it to the other side. Use this to move the annotation away from other components.
Note
The displacement direction and label rotation are a snapshot of the axes limits and size at the time dimension is called, so call it after the data has been plotted and the limits have been set. Linear, unrotated axes are assumed.
label (None | str | AbstractScalar) – The text label for the dimension. If
None, the measured distance \(|b - a|\), rounded to decimals places, is used.decimals (int) – The number of decimal places to round the default label to. Ignored if label is given explicitly.
gap (float | AbstractScalar) – The fraction of the offset distance to leave as a gap between each point and the start of its extension line, matching the convention of a mechanical drawing.
rotate (bool) – If
True, the default, rotate the label to match the on-screen angle of the dimension line. IfFalse, draw the label horizontally.ax (None | Axes | AbstractScalar) – A matplotlib axes instance on which to plot the dimension.
components (None | tuple[str, str]) – If a and b have more than two components, use this argument to specify which components correspond to the horizontal and vertical positions.
arrowstyle (str) – The
matplotlib.patches.ArrowStyleused to draw the dimension line. Defaults to a double-headed arrow,"<->".kwargs_extension (None | dict[str, Any]) – Additional keyword arguments passed to
plot()when drawing the extension lines.kwargs_dimension (None | dict[str, Any]) – Additional keyword arguments passed to
annotate()when drawing the dimension line.kwargs_text (None | dict[str, Any]) – Additional keyword arguments passed to
text()when drawing the label.kwargs – Additional keyword arguments passed to
plot(),annotate(), andtext().
- Return type:
The array of annotations representing the dimension lines.
Examples
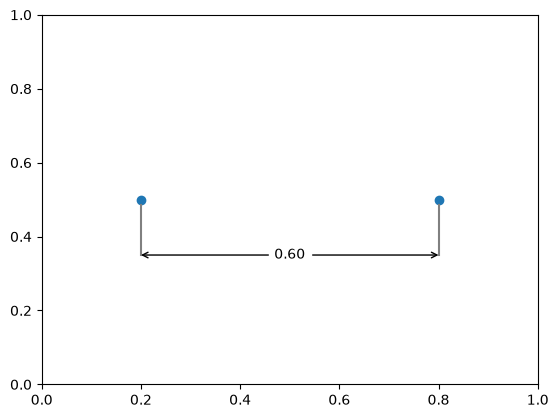
Dimension a horizontal distance, displaced below the segment to clear a plotted marker.
import numpy as np
import matplotlib.pyplot as plt
import named_arrays as na

a = na.Cartesian2dVectorArray(0.2, 0.5)
b = na.Cartesian2dVectorArray(0.8, 0.5)

fig, ax = plt.subplots()
na.plt.scatter(
    na.stack([a.x, b.x], axis="point"),
    na.stack([a.y, b.y], axis="point"),
    ax=ax,
)
na.plt.dimension(a, b, offset=-0.15, ax=ax)
ax.set_xlim(0, 1)
ax.set_ylim(0, 1)
(0.0, 1.0)
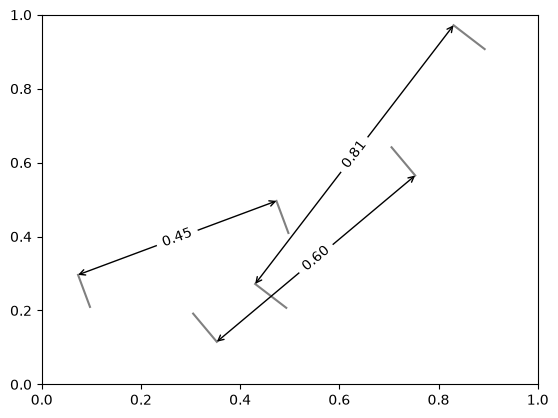
Dimension an array of distances, alternating the side the annotation is displaced to.
num = 3

a = na.Cartesian2dVectorArray(
    x=na.linspace(0.1, 0.5, axis="d", num=num),
    y=0.2,
)
b = na.Cartesian2dVectorArray(
    x=na.linspace(0.5, 0.9, axis="d", num=num),
    y=na.linspace(0.4, 0.9, axis="d", num=num),
)
offset = na.ScalarArray(np.array([0.1, -0.1, 0.1]), axes="d")

fig, ax = plt.subplots()
na.plt.dimension(a, b, offset=offset, ax=ax)
ax.set_xlim(0, 1)
ax.set_ylim(0, 1)
(0.0, 1.0)