histogram#
- named_arrays.histogram(a, bins, axis=None, min=None, max=None, density=False, weights=None)#
A thin wrapper around
numpy.histogram()which adds an axis argument.- Parameters:
a (AbstractArray) – The input data over which to compute the histogram.
bins (dict[str, int] | AbstractArray) –
- The bin specification of the histogram:
If bins is a dictionary, the keys are interpreted as the axis names and the values are the number of bins along each axis. This dictionary must have only one key per coordinate.
If bins is an array, it represents the bin edges.
axis (None | str | Sequence[str]) – The logical axes along which to histogram the data points. If
None(the default), the histogram will be computed along all the axes of a.min (None | float | AbstractArray) – The lower boundary of the histogram. If
None(the default), the minimum of a is used.max (None | float | AbstractArray) – The upper boundary of the histogram. If
None(the default), the maximum of a is used.density (bool) – If
False(the default), returns the number of samples in each bin. IfTrue, returns the probability density in each bin.weights (None | AbstractArray) – An optional array weighting each sample.
- Return type:
Examples
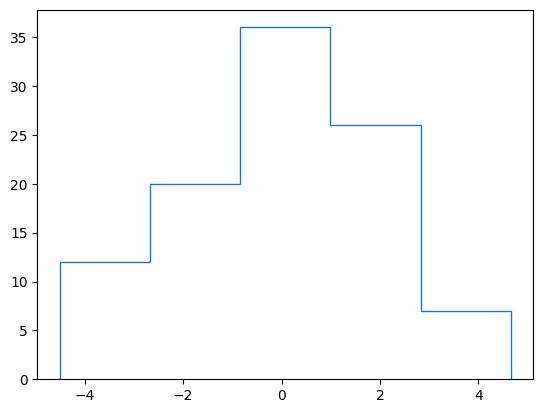
Construct a 2D histogram with constant bin width.
import numpy as np
import matplotlib.pyplot as plt
import named_arrays as na

# Define the bin edges
bins = dict(x=6)

# Define random points to collect into a histogram
a = na.random.normal(0, 2, shape_random=dict(h=101))

# Compute the histogram
hist = na.histogram(a, bins=bins)

# Plot the resulting histogram
fig, ax = plt.subplots()
na.plt.stairs(hist.inputs, hist.outputs);