imshow#
- named_arrays.plt.imshow(X, *, axis_x, axis_y, axis_rgb=None, ax=None, cmap=None, norm=None, aspect=None, alpha=None, vmin=None, vmax=None, extent=None, **kwargs)#
A thin wrappper around
matplotlib.pyplot.imshow()for named arrays.- Parameters:
X (AbstractArray) – The image data.
axis_x (str) – The name of the horizontal axis.
axis_y (str) – The name of the vertical axis
axis_rgb (None | str) – The optional name of the color axis.
ax (None | Axes | AbstractArray) – The instances of
matplotlib.axes.Axesto use. IfNone, callsmatplotlib.pyplot.gca()to get the current axes. If an instance ofnamed_arrays.ScalarArray,ax.shapeshould be a subset of the broadcasted shape of*args.cmap (None | str | Colormap) – The Colormap instance or registered colormap name used to map scalar data to colors.
norm (None | str | Normalize) – The normalization method used to scale the data into the range 0 to 1 before mapping colors.
aspect (None | int | float | complex | ndarray | Quantity | AbstractArray) – The aspect ratio of the Axes.
alpha (None | int | float | complex | ndarray | Quantity | AbstractArray) – The alpha blending value that ranges between 0 (transparent) and 1 (opaque).
vmin (None | int | float | complex | ndarray | Quantity | AbstractArray) – The minimum value of the data range.
vmax (None | int | float | complex | ndarray | Quantity | AbstractArray) – The maximum value of the data range.
extent (None | int | float | complex | ndarray | Quantity | AbstractArray) – The bounding box in data coordinates that the image will fill. The logical axis name of the bounding box should be
f"{axis_x},{axis_y}kwargs – An additional keyword arguments that are passed to
matplotlib.pyplot.imshow().
- Return type:
Examples
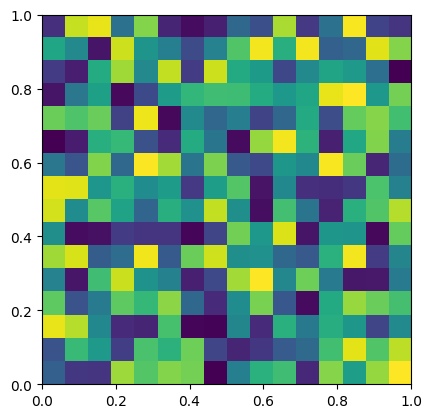
Plot a random 2d array.
import numpy as np
import matplotlib.pyplot as plt
import named_arrays as na

# Define the horizontal and vertical axis names of the image
axis_x = "x"
axis_y = "y"

# Define a random dummy array to plot
a = na.random.uniform(
    low=0,
    high=1,
    shape_random={axis_x: 16, axis_y: 16},
)

# Create the plot axes
fig, ax = plt.subplots()

# Plot the dummy array
na.plt.imshow(
    a,
    axis_x=axis_x,
    axis_y=axis_y,
    ax=ax,
    extent=na.ScalarArray(
        ndarray=np.array([0, 1, 0, 1]),
        axes=f"{axis_x},{axis_y}",
    ),
);
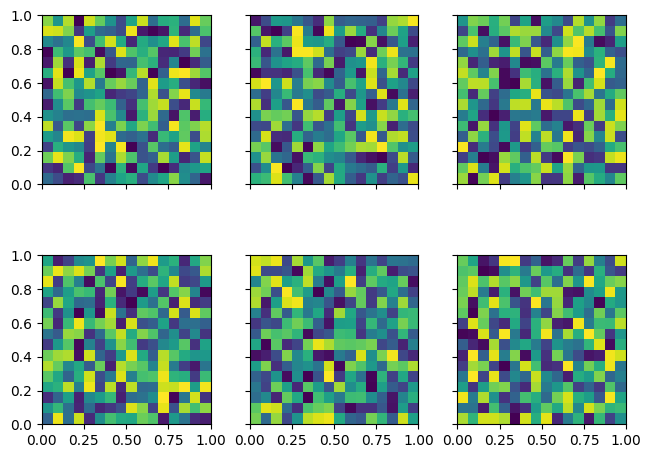
Plot a grid of 2d dummy arrays
import numpy as np
import matplotlib.pyplot as plt
import named_arrays as na

# Define the horizontal and vertical axis names of the plot
axis_x = "x"
axis_y = "y"

# Define the row and column axis names of the plot
axis_rows = "row"
axis_cols = "col"

# Define the number of rows and columns of the plot
num_rows = 2
num_cols = 3

# Define a random dummy array to plot
a = na.random.uniform(
    low=0,
    high=1,
    shape_random={
        axis_rows: num_rows,
        axis_cols: num_cols,
        axis_x: 16,
        axis_y: 16,
    }
)

# Define the array of matplotlib axes
fig, axs = na.plt.subplots(
    axis_rows=axis_rows,
    nrows=num_rows,
    axis_cols=axis_cols,
    ncols=num_cols,
    sharex=True,
    sharey=True,
    constrained_layout=True,
)

# Plot the dummy arrays
na.plt.imshow(
    a,
    axis_x=axis_x,
    axis_y=axis_y,
    ax=axs,
    extent=na.ScalarArray(
        ndarray=np.array([0, 1, 0, 1]),
        axes=f"{axis_x},{axis_y}",
    ),
);