annotate#
- named_arrays.plt.annotate(text, xy, xytext=None, components=None, ax=None, xycoords='data', textcoords=None, arrowprops=None, annotation_clip=None, **kwargs)#
A thin wrapper around
matplotlib.axes.Axes.annotate()for named arrays.- Parameters:
text (str | AbstractScalarArray) – The text of the annotation
xy (VectorT) – The point to annotate in the coordinate system of xycoords.
xytext (None | VectorT) – The point to place the text in the coordinate system of textcoords.
components (None | tuple[str, str]) – If xy has more than two components, use this argument to specify which components correspond to horizontal and vertical positions.
ax (None | Axes | AbstractArray) – The matplotlib axes instance on which to plot the annotation.
xycoords (str | Transform | AbstractScalarArray | VectorT) – The coordinate system that xy is given in.
textcoords (None | str | Transform | AbstractScalarArray | VectorT) – The coordinate system that xytext is given in.
arrowprops (None | dict) – The properties used to draw the arrow.
annotation_clip (None | bool | AbstractScalarArray) – Whether to draw the annotation when the point is outside the axes limits.
kwargs – Additional arguments passed to
matplotlib.text.Text
- Return type:
ScalarArray[ndarray[tuple[Any, …], dtype[Annotation]]]
Examples
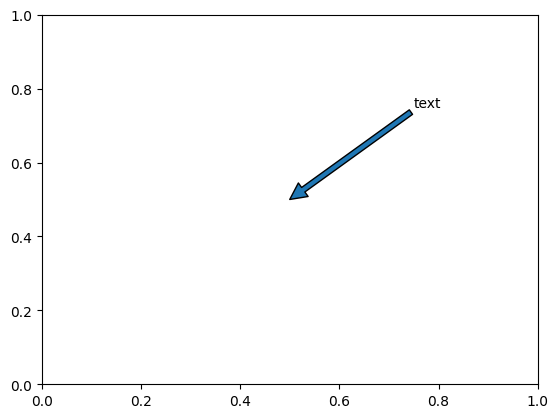
Plot a single annotation
import matplotlib.pyplot as plt
import named_arrays as na

fig, ax = plt.subplots()
ann = na.plt.annotate(
    text="text",
    xy=na.Cartesian2dVectorArray(x=.5, y=.5),
    xytext=na.Cartesian2dVectorArray(x=.75, y=.75),
)
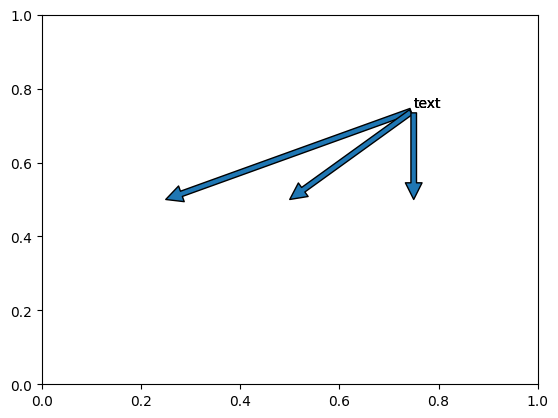
Plot annotations in a vectorized fashion
fig, ax = plt.subplots()
ann = na.plt.annotate(
    text="text",
    xy=na.Cartesian2dVectorArray(
        x=na.linspace(.25, .75, axis="x", num=3),
        y=.5,
    ),
    xytext=na.Cartesian2dVectorArray(x=.75, y=.75),
)