rgb_and_colorbar#
- named_arrays.colorsynth.rgb_and_colorbar(spd, wavelength=None, axis=None, spd_min=None, spd_max=None, spd_norm=None, wavelength_min=None, wavelength_max=None, wavelength_norm=None)#
Convenience function that calls
rgb()andcolorbar()and returns the results as a tuple.- Parameters:
spd (AbstractArray) – A spectral power distribution to convert to a RGB array.
wavelength (None | AbstractScalar) – The wavelength coordinates corresponding to the spectral power distribution. If
None(the default), the wavelength is assumed to be evenly sampled over the human visible range.axis (None | str) – The logical axis corresponding to changing wavelength. If
None(the default), spd must be one-dimensional.spd_min (None | int | float | complex | ndarray | Quantity | AbstractArray) – The value of the spectral power distribution representing minimum intensity
spd_max (None | int | float | complex | ndarray | Quantity | AbstractArray) – The vale of the spectral power distribution representing maximum intensity
spd_norm (None | Callable) – An optional function that transforms the spectral power distribution values before mapping to RGB.
wavelength_min (None | int | float | complex | ndarray | Quantity | AbstractScalar) – The wavelength value that is mapped to the minimum wavelength of the human visible color range, 380 nm.
wavelength_max (None | int | float | complex | ndarray | Quantity | AbstractScalar) – The wavelength value that is mapped to the maximum wavelength of the human visible color range, 700 nm
wavelength_norm (None | Callable) – An optional function to transform the wavelength values before they are mapped into the human visible color range.
- Return type:
tuple[AbstractArray, FunctionArray[Cartesian2dVectorArray, AbstractScalar]]
See also
colorsynth.colorbar()Equivalent function for instances of
numpy.ndarray.
Examples
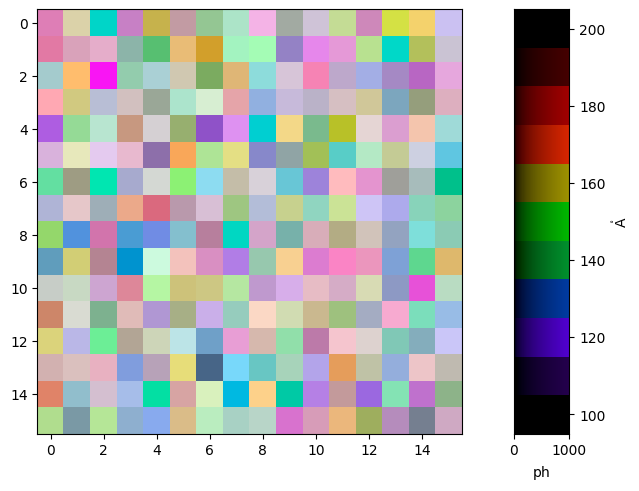
Plot a colorized 3D cube along with its colorbar.
import matplotlib.pyplot as plt
import astropy.units as u
import astropy.visualization
import named_arrays as na

# Define a random 3d cube
a = na.random.uniform(
    low=0 * u.photon,
    high=1000 * u.photon,
    shape_random=dict(x=16, y=16, wavelength=11),
)

# Define wavelength axis
wavelength = na.linspace(
    start=100 * u.AA,
    stop=200 * u.AA,
    axis="wavelength",
    num=a.shape["wavelength"],
)

# Compute the RGB colors of the 3D cube along with its colorbar.
rgb, colorbar = na.colorsynth.rgb_and_colorbar(
    spd=a,
    wavelength=wavelength,
    axis="wavelength",
)

# Plot the colorized cube along with its colorbar.
with astropy.visualization.quantity_support():
    fig, axs = plt.subplots(
        ncols=2,
        gridspec_kw=dict(width_ratios=[.9,.1]),
        constrained_layout=True,
    )
    na.plt.imshow(
        rgb,
        axis_x="x",
        axis_y="y",
        axis_rgb="wavelength",
        ax=axs[0],
    );
    na.plt.pcolormesh(
        C=colorbar,
        axis_rgb="wavelength",
        ax=axs[1],
    )
    axs[1].yaxis.tick_right()
    axs[1].yaxis.set_label_position("right")