scatter#
- named_arrays.plt.scatter(*args, s=None, c=None, ax=None, where=True, transformation=None, components=None, **kwargs)#
A thin wrapper around
matplotlib.axes.Axes.scatter()for named arrays.- Parameters:
args (AbstractScalar) – Same signature as
matplotlib.axes.Axes.scatter(). Ifaxis a 2D plot,*argsshould beyorx, y. Ifaxis a 3D plot,*argsshould bex, yorx, y, z.s (None | AbstractScalarArray) – The marker size in points**2
c (None | AbstractScalarArray) – The color of the markers
ax (None | Axes | ScalarArray[ndarray[tuple[Any, ...], dtype[Axes]]]) – The instances of
matplotlib.axes.Axesto use. IfNone, callsmatplotlib.pyplot.gca()to get the current axes. If an instance ofnamed_arrays.ScalarArray,ax.shapeshould be a subset of the broadcasted shape of*args.where (bool | AbstractScalar) – A boolean array that selects which elements to plot
transformation (None | AbstractTransformation) – A callable that is applied to args before plotting
components (None | tuple[str, ...]) – The component names of
*argsto plot, helpful if*argsare an instance ofnamed_arrays.AbstractVectorArray.kwargs – Additional keyword arguments passed to
matplotlib.axes.Axes.scatter(). These can be instances ofnamed_arrays.AbstractArray.
- Return type:
Examples
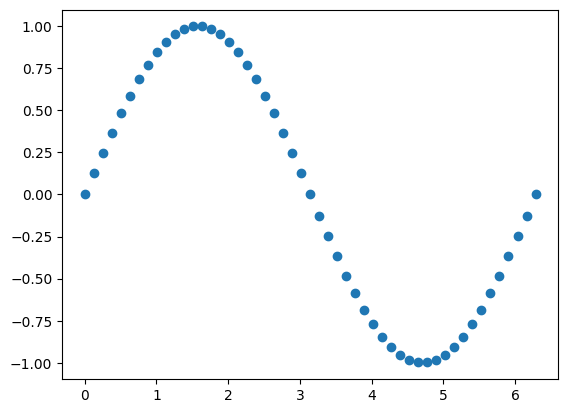
Plot a single scalar
import numpy as np
import matplotlib.pyplot as plt
import named_arrays as na

x = na.linspace(0, 2 * np.pi, axis="x",  num=51)
y = np.sin(x)

plt.figure();
na.plt.scatter(x, y);
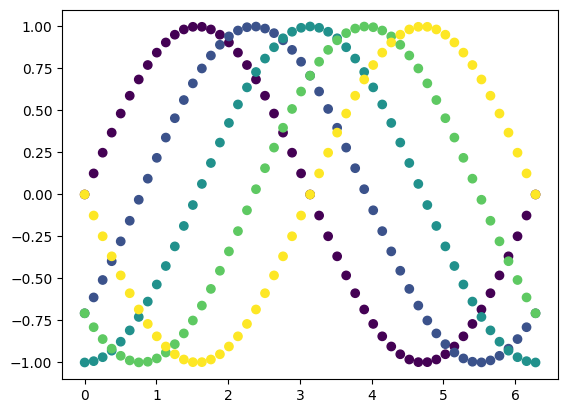
Plot an array of scalars
z = na.linspace(0, np.pi, axis="z", num=5)

y = np.sin(x - z)

plt.figure();
na.plt.scatter(x, y, c=z);
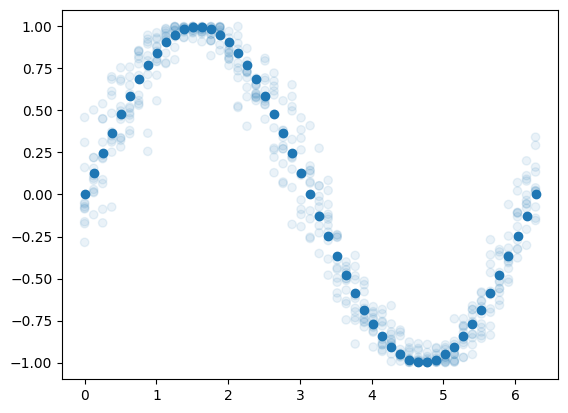
Plot an uncertain scalar
ux = na.NormalUncertainScalarArray(x, width=0.2)
uy = np.sin(ux)

plt.figure();
na.plt.scatter(x, uy);
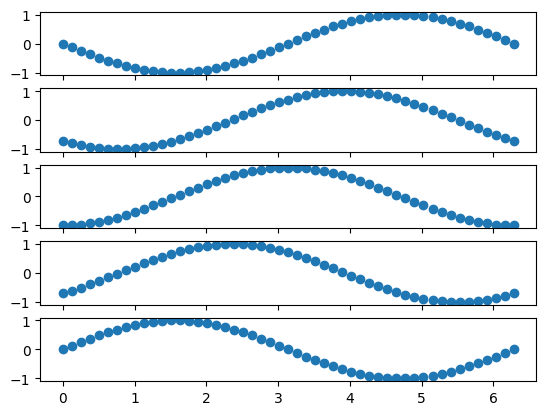
Broadcast an array of scalars against an array of
matplotlib.axes.Axesfig, ax = na.plt.subplots(axis_rows="z", nrows=z.shape["z"], sharex=True) na.plt.scatter(x, y, ax=ax);