rgbmesh#
- named_arrays.plt.rgbmesh(*WXY, C, axis_wavelength, ax=None, norm=None, vmin=None, vmax=None, wavelength_norm=None, wavelength_min=None, wavelength_max=None, **kwargs)#
A convenience function that calls
pcolormesh()with the outputs fromnamed_arrays.colorsynth.rgb()and returns a colorbar.This allows us to plot 3D cubes, with the third dimension being represented by color, using a
pcolormesh()-like interface.- Parameters:
WXY (AbstractScalar | AbstractCartesian2dVectorArray | AbstractSpectralPositionalVectorArray) – The coordinates of the mesh to plot. Allowed combinations are: an instance of
named_arrays.AbstractSpectralPositionalVectorArray, an instance ofnamed_arrays.AbstractScalarand an instance ofnamed_arrays.AbstractCartesian2dVectorArrayor three instances ofnamed_arrays.AbstractScalar.C (AbstractScalar) – The mesh data.
axis_wavelength (str) – The logical axis representing changing wavelength coordinate.
ax (None | Axes | AbstractArray) – The instances of
matplotlib.axes.Axesto use. IfNone, callsmatplotlib.pyplot.gca()to get the current axes. If an instance ofnamed_arrays.ScalarArray,ax.shapeshould be a subset of the broadcasted shape of*args.norm (None | Callable) – An optional function that transforms the spectral power distribution values before mapping to RGB. Equivalent to the spd_norm argument of
named_arrays.colorsynth.rgb().vmin (None | int | float | complex | ndarray | Quantity | AbstractArray) – The value of the spectral power distribution representing minimum intensity. Equivalent to the spd_min argument of
named_arrays.colorsynth.rgb().vmax (None | int | float | complex | ndarray | Quantity | AbstractArray) – The value of the spectral power distribution representing maximum intensity. Equivalent to the spd_max argument of
named_arrays.colorsynth.rgb().wavelength_norm (None | Callable) – An optional function to transform the wavelength values before they are mapped into the human visible color range.
wavelength_min (None | float | Quantity | AbstractScalar) – The wavelength value that is mapped to the minimum wavelength of the human visible color range, 380 nm.
wavelength_max (None | float | Quantity | AbstractScalar) – The wavelength value that is mapped to the maximum wavelength of the human visible color range, 700 nm
kwargs – Additional keyword arguments passed to
matplotlib.pyplot.pcolormesh().
- Return type:
Examples
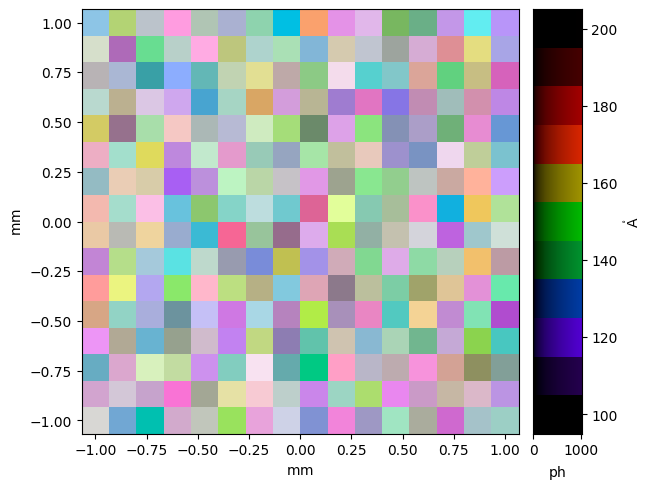
Plot a random, 3D cube.
import matplotlib.pyplot as plt
import astropy.units as u
import astropy.visualization
import named_arrays as na

# Define a random 3d cube
a = na.random.uniform(
    low=0 * u.photon,
    high=1000 * u.photon,
    shape_random=dict(x=16, y=16, wavelength=11),
)

# Define wavelength coordinates
wavelength = na.linspace(
    start=100 * u.AA,
    stop=200 * u.AA,
    axis="wavelength",
    num=a.shape["wavelength"],
)

# Define spatial coordinates
x = na.linspace(-1, 1, axis="x", num=a.shape["x"]) * u.mm
y = na.linspace(-1, 1, axis="y", num=a.shape["y"]) * u.mm

# Plot the colorbar
with astropy.visualization.quantity_support():
    fig, axs = plt.subplots(
        ncols=2,
        gridspec_kw=dict(width_ratios=[.9,.1]),
        constrained_layout=True,
    )
    colorbar = na.plt.rgbmesh(
        wavelength, x, y,
        C=a,
        axis_wavelength="wavelength",
        ax=axs[0],
    );
    na.plt.pcolormesh(
        C=colorbar,
        axis_rgb="wavelength",
        ax=axs[1],
    )
    axs[1].yaxis.tick_right()
    axs[1].yaxis.set_label_position("right")