plot#
- named_arrays.plt.plot(*args, ax=None, axis=None, where=True, transformation=None, components=None, **kwargs)#
A thin wrapper around
matplotlib.axes.Axes.plot()for named arrays.The main difference of this function from
matplotlib.pyplot.plot()is the addition of theaxisparameter indicating along which axis the lines should be connected.- Parameters:
args (AbstractScalar) – Same signature as
matplotlib.axes.Axes.plot(). Ifaxis a 2D plot,*argsshould beyorx, y. Ifaxis a 3D plot,*argsshould bex, yorx, y, z.ax (None | Axes | ScalarArray[ndarray[tuple[Any, ...], dtype[Axes]]]) – The instances of
matplotlib.axes.Axesto use. IfNone, callsmatplotlib.pyplot.gca()to get the current axes. If an instance ofnamed_arrays.ScalarArray,ax.shapeshould be a subset of the broadcasted shape of*args.axis (None | str) – The name of the axis that the plot lines should be connected along. If
None, the broadcasted shape ofargsshould have only one element, otherwise aValueErroris raised.where (bool | AbstractScalar) – A boolean array that selects which elements to plot
transformation (None | AbstractTransformation) – A callable that is applied to args before plotting
components (None | tuple[str, ...]) – The component names of
*argsto plot, helpful if*argsare an instance ofnamed_arrays.AbstractVectorArray.kwargs – Additional keyword arguments passed to
matplotlib.axes.Axes.plot(). These can be instances ofnamed_arrays.AbstractArray.
- Return type:
An array of artists that were plotted
Examples
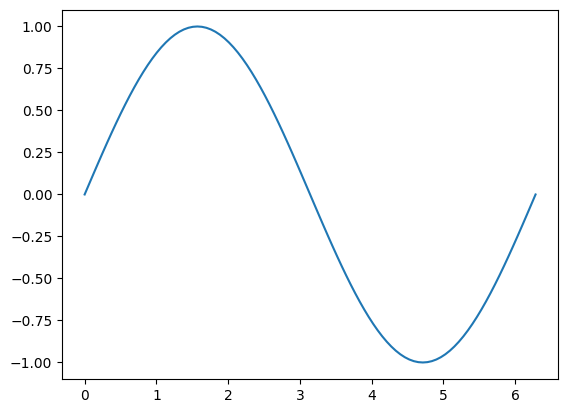
Plot a single scalar
import numpy as np
import matplotlib.pyplot as plt
import named_arrays as na

x = na.linspace(0, 2 * np.pi, axis="x",  num=101)
y = np.sin(x)

plt.figure();
na.plt.plot(x, y);

Plot an array of scalars
z = na.linspace(0, np.pi, axis="z", num=5)

y = np.sin(x - z)

plt.figure();
na.plt.plot(x, y, axis="x");

Plot an uncertain scalar
ux = na.NormalUncertainScalarArray(x, width=0.2)
uy = np.sin(ux)

plt.figure();
na.plt.plot(x, uy);

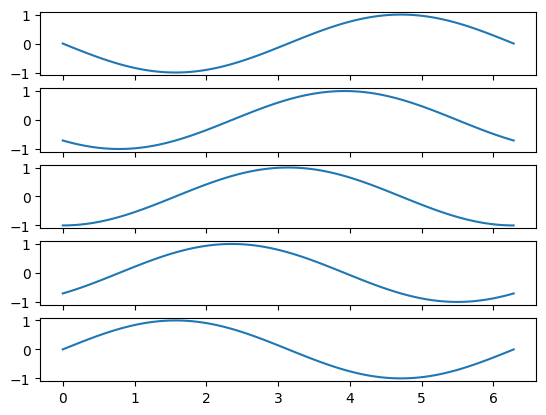
Broadcast an array of scalars against an array of
matplotlib.axes.Axesfig, ax = na.plt.subplots(axis_rows="z", nrows=z.shape["z"], sharex=True) na.plt.plot(x, y, ax=ax, axis="x");
Plot a 2D Cartesian vector
v = na.Cartesian2dVectorArray(x, np.sin(x))

plt.figure()
na.plt.plot(v)
ScalarArray(
    ndarray=<matplotlib.lines.Line2D object at 0x7a0fadc93a10>,
    axes=(),
)